FY24-25 Weekly Data
Weekly Market Trends: 30 June 2024 – 13 July 2025
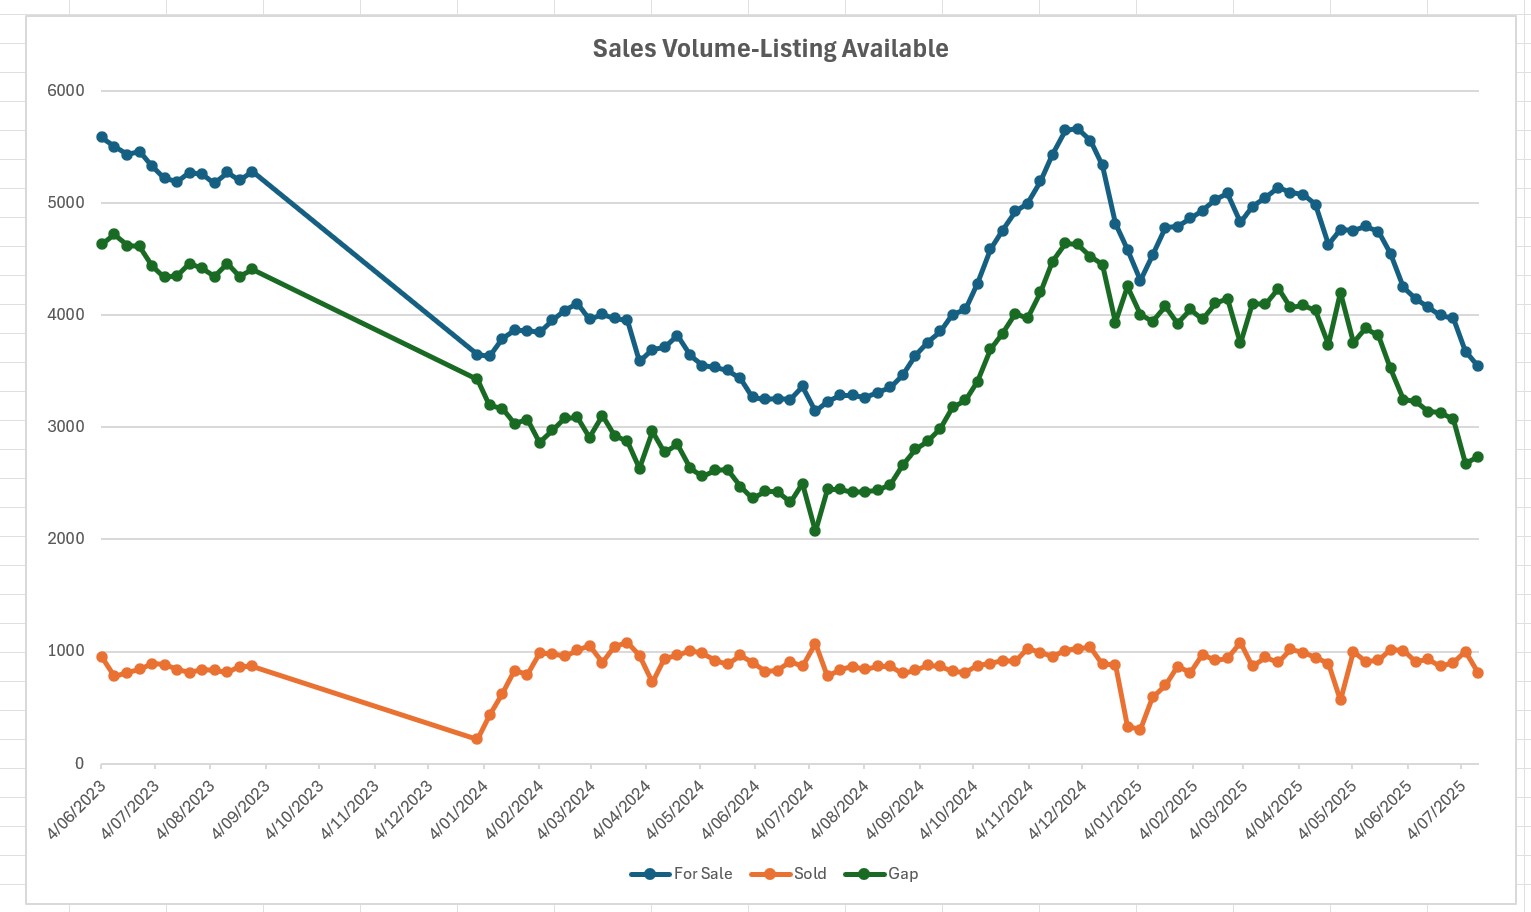
During the period from 30 June 2024, the property market experienced a clear cycle in the number of listings available for sale each week:
- The weekly "For Sale" listings initially dropped to a low of 3,144 on 7 July 2024, marking the tightest supply point during this timeframe.
- From that low, listings began increasing steadily, peaking at 5,661 on 1 December 2024, an 80% rise in inventory over five months.
- Since December 2024, there has been a consistent downward trend, with listings falling back to 3,545 by 13 July 2025, a drop of nearly 38% from the December peak.
This indicates a tightening of supply in 2025, likely due reduced new listings, or seasonal effects.
Sales Activity
- The number of properties sold weekly remained relatively stable & consistent, mostly ranging between 850–1,000 since early 2025.
- Notable peaks in weekly sales include:
- 1,079 sold (2 March 2025)
- 1,017 sold (25 May 2025)
- These peaks interestingly positioned just after the two 0.25% rate cuts.
- There’s no strong upward or downward trend in sales volume, suggesting demand remains consistent, even as supply tightens.
Summary
The market from mid-2024 to mid-2025 reflects a cyclical pattern in supply, with a strong build-up of listings through late 2024, followed by a marked decline in availability through 2025. Meanwhile, sales volumes have remained relatively healthy and consistent, which may contribute to the current inventory contraction.
This pattern points to a tightening market in 2025, with potential upward pressure on prices if demand continues and new supply remains limited.
Sean Kum